Hey, Sponge community!
Few days ago, after successful transitioning from Spigot to SpongeForge and re-opening my not-so-big almost-vanilla server, I ran into an annoying problem. Server starts to freeze after roughly 3 to 6 hours of intensive gameplay since scheduled restart. The message says “Can’t keep up …”. Yes, I understand that the server could not do what it’s told to be done, but it confuses me even more: TPS always stays at 20, RAM usage does not come close to its limit.
Actually, I suspect it has something to do with high CPU load (it raises to a crazy number for a second or two during the lag, then immediately goes down again), though I can’t think of anything that can cause this to happen.
My observations:
- Sometimes spikes are following a pattern (showing up every 15 seconds), sometimes - they’re not.
- Insane CPU load during the lag. (500-700%). Lagless load is 50-70%, ten times lower.
- Entities & TileEntities consume most of the server tick. Nothing else stands out besides that.
- Clearly, there is a big amount of entities out there (as seen in timings reports) because of the world size, but removing them is not an option. Players won’t be happy with that.
- Average lag always drops out from 40 to 80 ticks (2-4 seconds).
- “TPS Loss” happens.
- I could not replicate this on any copy of the server. Think it somehow connected to players count.
What I’ve tried so far (obviously, none of that helped):
- Lowering entity spawns / trigger distances.
- Lowering tileentity tick rate.
- Abolutely disabling entity spawns.
- Removing suspicious plugins.
- Tweaking launch options, lowering / raising -Xms(x) values. This is what I came to.
-Xms5G -Xmx5G -XX:+UseG1GC -XX:+UnlockExperimentalVMOptions -XX:MaxGCPauseMillis=100 -XX:+DisableExplicitGC -XX:TargetSurvivorRatio=90 -XX:G1NewSizePercent=50 -XX:G1MaxNewSizePercent=80 -XX:InitiatingHeapOccupancyPercent=10 -XX:G1MixedGCLiveThresholdPercent=50 -XX:+AggressiveOpts -XX:+AlwaysPreTouch -XX:+UseLargePagesInMetaspace -jar forge-1.12.2-14.23.1.2607-universal.jar
- Exploring Timings / WarmRoast reports (as I said, I didn’t find anything outstanding besides entities. But I could miss something).
So, the lag process itself is pretty clear, but I can’t find the exact reason, which is why I seek your assistance.
Timings:
https:// timings.aikar.co/?id=c493d83adc4c4feaacdc8207ab824867 (~16h uptime)
WarmRoast
All threads .html file http://dropmefiles.com/VsqeC (~16h uptime)
Thanks for your attention, hope we find a solution ASAP.
Can we have a bit more information on your setup, and a /gc output? If you could also tell us what plugins you’ve removed/added, it would help narrow down for us as well. There are some questions concerning chunk load/gen as well as updating, but it seems your server is not generating any chunks.
In your Sponge global.conf, please lengthen your timings as much as you can and have it run before pasting it back here. 3 minutes is not enough to ascertain much, and the ‘lag’ seems a constant drop.
Of course you can! Not a big deal.
You’re right, all chunks inside world borders are already generated, so generation is not the case.
Tried to meddle with RedProtect / Nucleus / AntiXray - sadly, that did not help.
/gc stats:
================== Server Statistics ===================
Current TPS: 20.00/20.00
Average TPS for session: 19.77/20.00
Server Uptime: 16 hours, 50 minutes, 24 seconds
JVM Uptime: 16 hours, 50 minutes, 53 seconds
Maximum allocatable memory: 5120 MB
Allocated memory: 5120 MB
Utilised memory: 3899 MB (76% of allocated, 76% of max)
Free (but allocated) memory: 1221 MB
World: world
Type: overworld, Generator: default, Entities: 2901, Loaded chunks: 4884
======================== « » =========================
Several seconds later:
================== Server Statistics ===================
Current TPS: 13.91/20.00
Average TPS for session: 19.77/20.00
Server Uptime: 16 hours, 50 minutes, 41 seconds
JVM Uptime: 16 hours, 51 minutes, 9 seconds
Maximum allocatable memory: 5120 MB
Allocated memory: 5120 MB
Utilised memory: 3277 MB (64% of allocated, 64% of max)
Free (but allocated) memory: 1843 MB
World: world
Type: overworld, Generator: default, Entities: 2910, Loaded chunks: 4901
======================== « » =========================
UPD: Gathered Timings report for the last 2 hours - can wait more if you need.
https://timings.aikar.co/?id=3ad751e0845e4f548d3b24cd2a2356c3
I am a bit flabbergasted by such a huge timings, first time in two years. Didn’t even know it could run that long. Huh.
Anyways, it doesn’t look like it can find any spiking, and that’s probably due to the length of the timings. In taking out mods, did you try without RedProtect only? I haven’t seen much in terms of optimization with, so I’d still see if it has any strain on event checks.
Another matter to consider is how consistent these spikes are. Do they happen every world save? Or evey time players load chunks and mob spawns? Considering you’ve disabled completely spawns, my bet is on world save. Perhaps you could try making the intervals (of world save) last longer, to see if it correlates to the spiking you feel. The server is definitely spiking though, and that’s a good and bad thing to confirm - means it isn’t FPS/client-side related, but it also means something is wrong with your setup.
Nevertheless, you can still improve that config by tweaking your tile-entity/entity activation ranges and allowing structure saving, auto-populating it to help along the world saves. You could also lower the view-distance in your server.properties.
EDIT: Reason why I think it is related to world saving is because it is directly related to player count. More players, more chunks loaded. More chunks loaded, more entities, tile-entities and block updates. After a couple of hours, you could definitely see issues if those chunks are not despawning, or if entities linger behind. World saves would then get pretty heavy. Best way to address that is seeing if the activation ranges (found in Sponge’s global.conf) make any change.
Do you know the specs of your hardware? Could it be the lack of an SSD? Sometimes world saves can lag the server rather badly if you are still using HDD (aka RustDisks)
Basic configuration: Intel® Core™ i7-4770 Quadcore Haswell - 4 cores, 32 GB DDR3 RAM, 2 x 240 GB 6 Gb/s SSD
OS: Debian 8 Jessie 64 bit
Total worlds size is 6,3 Gb, so saving shouldn’t lead to any problems.
UPD: 12h Timings report: Aikar's Timings Viewer
It seems there’s nothing interesting in it. I’ll try to get new measurements at online peak, with Rasgnarok’s tips applied.
UPD2: My current sponge.cfg: http://dropmefiles.com/dxV3c
Unfortunately, none of Rasgnarok’s advices helped.
As I said, here it is - 1 hour Timings report with lag spikes & average online:
https://timings.aikar.co/?id=6df2cecaa75944f093beca85b944c042
I don’t have too much experience with timings, but I’ll give it a shot.
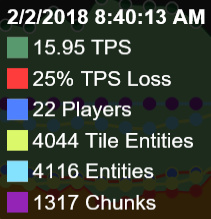
Looking at your timings, I’m noticing a clear correlation between TPS loss and entities. For example, here’s one of the higher ones:

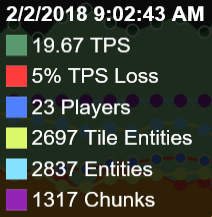
And here’s one from where the TPS loss drops:

This trend continues throughout the timings rather predictably. Note that the number of chunks and (roughly) players is the same, so for some reason there are a lot more entities in the world. Of course, I’m sure we all know that correlation doesn’t imply causation, so take this with a grain of salt.

In addition, the timings are also identifying two choke points with saving (Nucleus’ Data Modules & Forge’s Dimension Save). This implies that you might be saving the world too often or that there’s some timings issue with saving as it’s unlikely that both are high due to separate issues.
I spoke with Ras a couple nights ago about something similar with high entity counts, and it seems that was related to world settings not being persistent across restarts (somewhat related: #1506). This apparently became noticeable when updating from 2833 to 2844, but I don’t think that’s the primary cause personally.
In the meantime, I’d suggest looking for ways to limit the number of entities in your world - there are a couple settings in the Sponge config that can help, and a plugin to clear entities wouldn’t hurt either (though I personally believe this is hiding the issue, not fixing it). Additionally (not saying you aren’t), I’d check in every day or so for Sponge updates - 2871 has an inventory fix, so for that there’s no reason not to update.
Good luck, and may the timings be ever in your favour ^^
Now I can totally confirm that things get messy visually only past 2-3 hours from server start. Before that CPU-provoked lag spikes won’t happen, no matter how many players, chunks or (tile-)entities there are. Chunks unload fine, so I assume it could be one of the plugins working incorrectly.
[21:08:52] [Server thread/WARN]: Can’t keep up! Did the system time change, or is the server overloaded? Running 2704ms behind, skipping 54 tick(s)
[21:09:17] [Server thread/WARN]: Can’t keep up! Did the system time change, or is the server overloaded? Running 7630ms behind, skipping 152 tick(s)
[21:09:28] [Server thread/WARN]: Can’t keep up! Did the system time change, or is the server overloaded? Running 2882ms behind, skipping 57 tick(s)
[21:09:59] [Server thread/WARN]: Can’t keep up! Did the system time change, or is the server overloaded? Running 2266ms behind, skipping 45 tick(s)
Tried out TickProfiler, that’s what I get:
[TickProfiler]: Thread | Used CPU Time (%) Server thread | 19970.816
Aren’t there any CPU-profilers that could help me finding the lag trace?
OK, so it seems “Can’t keep up” occurs when RAM is fully used and Java GC kicks in.
Can you first try to tweak your activation ranges? The last timings does not seem to have the autopopulate on, and the settings are still default there. If it really is too many entities, you’d probably want to check if they are despawning properly - or if after three hours, they accumulate so much they cause that last timings.


